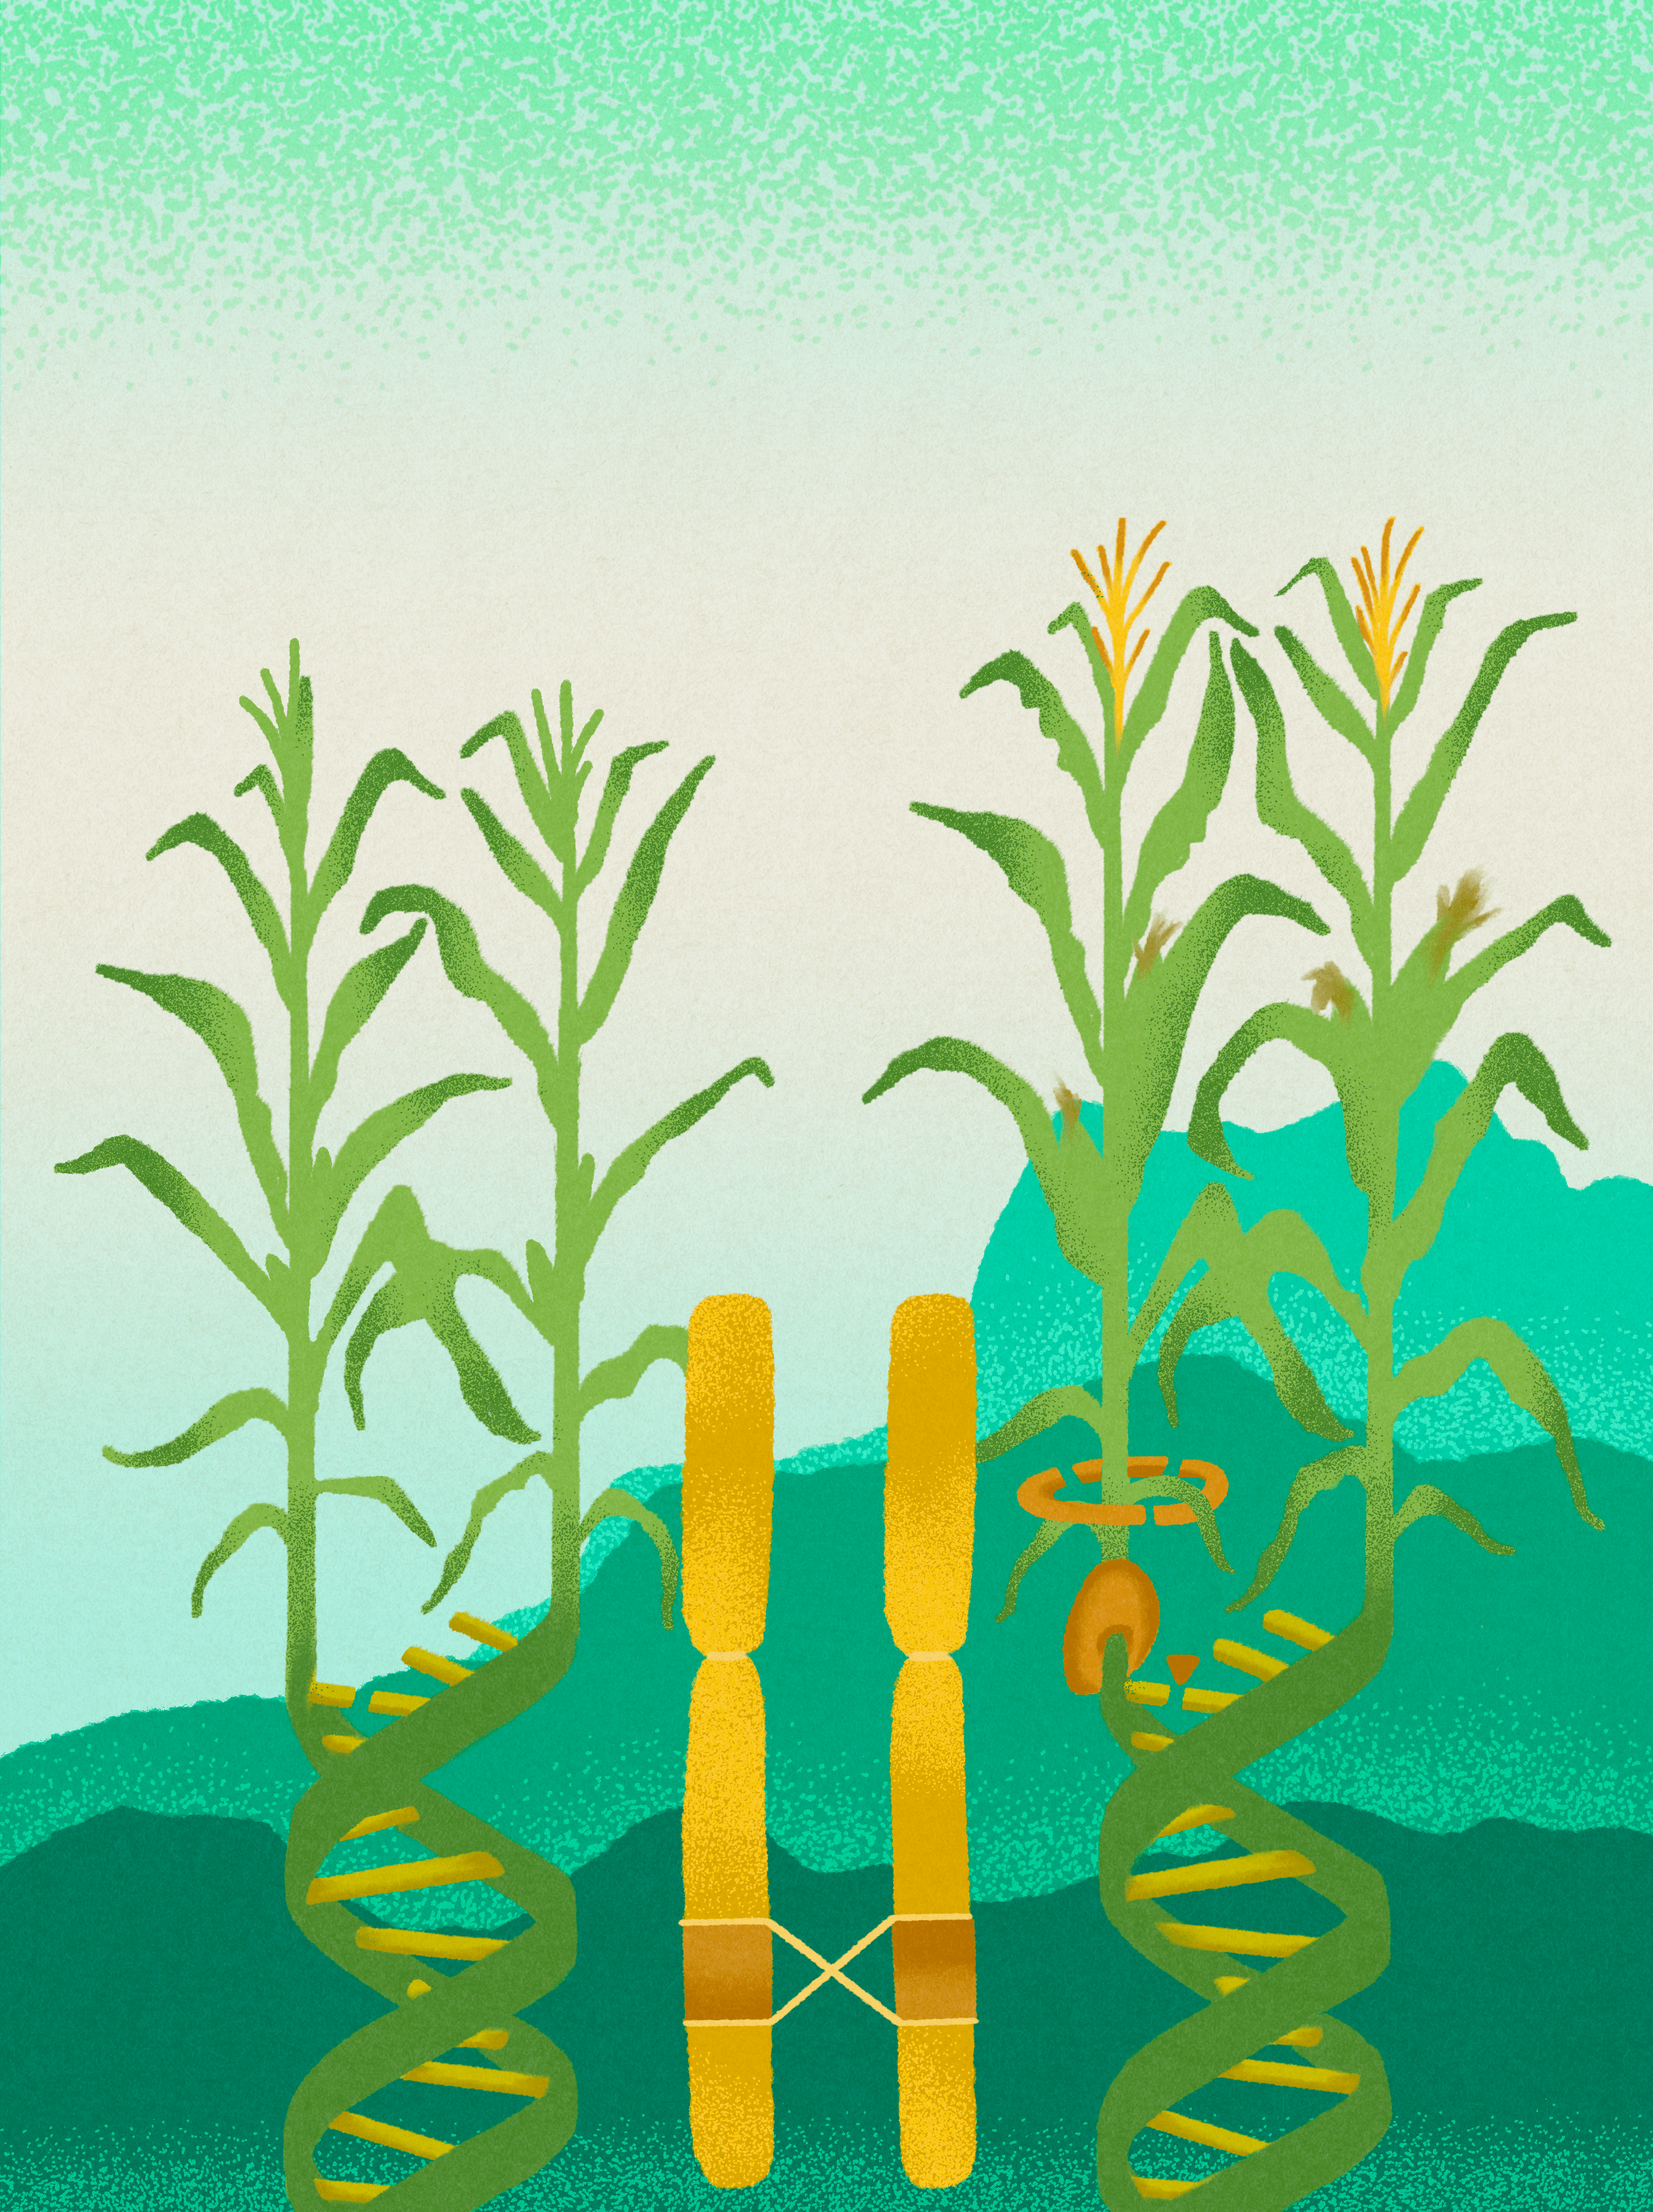
Genomic Analysis (Figure 1)
Multi-panel composition of the breeding scheme, repeat annotation, AnchorWave dotplots, breakpoint self-similarity, and population genotypes
Figure 1 (assembly)
Repeat tracks, breakpoint segments, and AnchorWave/jcvi dotplots for B73, Mi21, PT, TIL18
Figure 1 panels B–D
Inv4m-correlated SNP panel and chromosome distribution; produces the Figure 1 E–F panels and the Figure S1 SNP distribution plot
Figure 1 panels E–F, Figure S1, Table 1
Inv4m delimitation across four genomes (B73, Mi21, PT, TIL18) and knob-repeat composition at the breakpoints
Tables S1, S2
Phenotypic Effects
Effect of Inv4m on plant height, flowering time (DTA, DTS), and harvest index
Figure 2
DIC microscopy analysis of shoot apical meristem dimensions
Figure 2 (SAM panels)
Internode length profiles, node count, and height validation
Figure S4
Genotype × Environment interactions across 3 field environments (PA2022, PA2025, NC2025)
Figure S2, Figure S3, Table S4
Transcriptomics
8-panel composite figure showing global and local transcriptomic effects
Figure 3 (complete assembly)
Limma analysis of Inv4m effects on gene expression with plant-level blocking
Figure 3 (MDS panel), Table S3
Visualization of DEGs with labeled candidate genes (Figure 3 panel C)
Figure 3 panel C
Genome-wide visualization of expression effects by chromosome
Figure 3 panels D, E, G, H
Overlap of Inv4m DEGs with published flowering time and plant height candidate gene lists (GWAS Atlas, tibbs-cortes, wang2021, li2022)
Table 2
CDS sequence divergence between Mi21 and B73 vs differential expression of Inv4m DEGs
Supplementary Figure (divergence)
Network Analysis
MaizeNetome-validated trans-regulatory network of Inv4m DEGs (reference / dataset-specific edge split)
Figure 5 (network data)
Gene Ontology enrichment of trans-regulated gene networks; produces the Figure 5 annotation overlay
Figure 5 (GO panel)
Consensus network analysis showing module disruption in Inv4m: dendrogram, kWithin permutation Z-score density, and hub-gene connectivity
Figure 6, Table S5 (preservation)
Bootstrap support comparison between the Genotype Response and Leaf Gradient reference networks
Figure S5
7-step consensus WGCNA pipeline (data prep → consensus networks → bootstrap support → preservation → module annotation). Shell-orchestrated with checkpoint support.
Figure 6 panels, Figure S6 (GO), Table S5 (preservation)
JMJ Cluster Analysis (Figure 7)
Gene-level (V5 annotation) total cluster expression; 5:1 copy-number contrast t-test of B73 vs Inv4m across PA2022 field and Crow 2020 growth-chamber tissues. Also covers the cell-proliferation companion genes (pcna2, smo4).
Figure 7 panel A
30 DEGs co-expressed with jmj2/jmj4 in the pink WGCNA module (growth network)
Table S7
jcvi pipeline for JMJ cluster synteny across B73, PT, TIL18, CML457, CML459
Figure 7 panel B (bash script)
Transcript-level expression of all 5 JMJ paralogs (jmj9, psi, jmj6, jmj2, jmj4) using a kallisto-corrected cDNA reference where each paralog is a distinct entry. Read-distribution diagnostic.
Planned supplementary figure (manuscript TODO)
Reanalysis of growth chamber dataset for JMJ expression validation
Figure 7 panel A (Crow data)